- 7 minute read
- Digital Marketing
- Pay-Per-Click
- Websites
Advanced
Join hundreds of other operators and REGISTER NOW for Spark 2024 New Orleans October 13-15th!


Many tour operators — and all types of business owners — base business decisions off of metrics such as weekly sales accruals, customer feedback, and gut feelings. But when you’re looking to build your bottom line there’s so much more information to consider and that can be leveraged, such as gaining a deeper understanding of how your customers discover your company and how and why users engage with your brand. The first step to putting these metrics to work for you is to take a critical look at how you present yourself and the experiences you offer in the online space.
Google Analytics (GA) is one of the most useful tools to help you make important business decisions about your web presence. One of the best ways to view information in GA is by using reports. This guide will cover the most relevant GA reports for tour, activity, and attractions operators and how you can use them to improve your organic traffic and conversions.
 Pro tip: If you’re new to GA, it’s a good idea to take their beginner course before getting started with reports. If you haven’t already, we also recommend that you review our resource on how to effectively analyze data using the Discovery, Qualification, Conversion framework first.
GA Reports allow you to visualize information about your users, where they’re finding your website, and more. Business owners should use reports to better understand how to support your value/branding proposition, website structure and optimization, sales and pricing strategy, and SEO performance.
The type of report you should use will depend on the type of information you’re looking for:
Let’s take a look at some common scenarios and how you would use GA Reports to improve online performance. Go to the scenario that best applies to you or you’re most interested in to see what reports to use, what issues they can help you identify, and the solutions to these issues.
Scenario 1: Searchers aren’t finding my website organically.
Scenario 2: I want to expand my brand visibility outside of organic search.
Scenario 3: There is plenty of traffic to my site, but users aren’t converting.
Scenario 4: I’m seeing healthy conversion rates but feel there’s room to grow. Where do I start?
Use These Reports: Acquisitions, Page Timings
This is a common issue for businesses that can’t seem to get a leg up in search results. In spite of how much effort you sink into things like hotel concierge relationships, print advertising, or storefront T-shirt sales, at the end of the day, organic search should be driving the lion’s share of your profits. Fortunately, organic search is one of the most easily identifiable improvement targets for tour operators to act upon. GA offers ample insight into how your SEO efforts are translating to site traffic and, in turn, revenue.
The first place you should look to identify opportunities for SEO is the Acquisition Report, which you can access via the Acquisition > All Traffic > Channels reporting track in your GA dashboard.
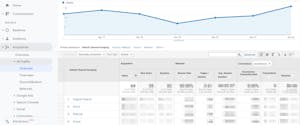
This report is often overlooked for its value in displaying the hierarchy of how your traffic is being acquired. Organic search should drive the majority of traffic to your website. It’s all about balance — if you see ample traffic hitting your site from organic mediums with a conversion rate that doesn’t deviate far from your average, you’re doing well for yourself. On the other hand, if you’re seeing a low organic traffic rate, this could point to a couple potential issues.
One more critical point to note when assessing your organic acquisition channels is that YoY data is just as critical as comparing organic traffic to your other channel groupings. If your overall traffic is down from last year, could it be due to a fluctuation in the market? It’s important to compare all your channels to get a full picture of your traffic patterns.
Use This Report: All Traffic Report
Strong SEO is the foundation of your web presence, but referring websites and social media channels can help expand your reach. Google Analytics can help you identify ways to expand your network to drive qualified customers to your website.
To get a full breakdown of where your traffic is coming from, let’s go back to your Acquisitions Report (Acquisition > All Traffic > Channels), this time paying close attention to the Referral and Social channels.
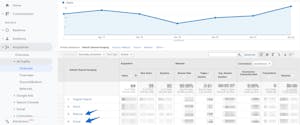
You’ll likely find that referral and social channels don’t send as much traffic to your website as organic search, which is natural — these are generally low-volume, high-performing mediums for sourcing site visitors. But you could be missing out on opportunities to send users to your website from referral sites and social media.
Click within each channel grouping to review a breakdown of source links. For referrals, look at which referral sites — such as Yelp, Tripadvisor, and other directories — are driving a lot of visitors to your business, yet aren’t converting as highly as the referral average (generally around 2 – 3%). Is your information on these pages optimized to get the right kind of visitor to click through to your page? Do you have a clear CTA?
Do the same for your social media channels and analyze how you could better direct traffic to your website. Do you have a book button on your Facebook page? Do your Instagram posts include a call to action? Start by making a couple changes to your pages and keep and eye on the All Traffic Report to see how they impact your conversions.
Use These Reports: Device Overview and Behavior Flow
A low conversion rate could stem from a variety of different of issues, but a great place to dig in is to review the different acquisition rates by device. Understanding how users are converting on desktop vs. mobile can give you a clear idea of where to make changes for immediate impact.
It’s possible that users are reaching your site on mobile and are not able to quickly find the information they need. In the travel industry, mobile generally drives more traffic to websites than desktop, but it has an abnormally low e-commerce conversion rate. Reviewing device reports allows you to quickly identify user experience (UX) issues that may be inherent to particular devices.
Mobile traffic accounts for 60% of all Google searches, and you can certainly expect this upward trend to continue. So as you can see, mobile users represent a cohort you need to accommodate effectively.
Let’s look at two reports that can help you understand UX by device and identify mobile conversion issues: the Device Overview report and the Behavior Flow report.
Let’s start with the Device Overview report, which you can find in Audience > Mobile > Overview.
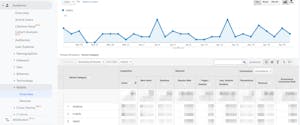
This report shows key information about how different devices generate revenue. Some important metrics to review include conversion rate (CR), revenue and transactions, sessions and bounce rate, avg. session duration, and avg. session value (which is not a column but is easily found by dividing revenue/session). If you notice abnormally lower CR on mobile, you can use this information to help you decide how to improve your website for mobile users.
With this information gleaned from Device Overview in mind, head over to Behavior > Behavior Flow, which gives a visual representation of the pages on your website that users reach and the paths they take to get there. You can filter for mobile traffic in the top left so that you can review mobile user paths only.
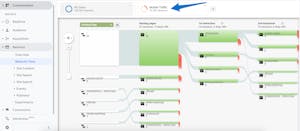
As you analyze this report, look for drops, loops, and non-linear page paths. Pay particular attention to the first interaction. Where do users go after landing on your website? In an ideal world, the perfect flow is Homepage > product page > FareHarbor embed. This is not always the case, depending on the breadth of your offerings, but conceptually this takes care of our three major signposts: Discovery > Qualification > Conversion. Users discover your brand and products > They qualify their interest and lead value > They convert by making a booking.
Next, compare your mobile flow to your desktop flow. Are users going to different pages on the first and second interactions? Are mobile users being driven to different paths than desktop users? These could be quick UX fixes, such as making sure that your revenue drivers are near the top of the page on mobile and users don’t have to scroll too much to find them. Making a simple change such as reducing the amount of vertical scroll can pay off immediately for your mobile revenue. Likewise, having sticky booking buttons that follow your customer’s scroll could help them stay on the path to conversion.
Use This Report: Landing Pages
So things are running smoothly but you still think there’s room for improvement? We do too. Even when traffic and conversions are looking good, Google Analytics allows you to identify opportunities to improve. Let’s revisit our Behavior Flow report to look for more loops, drops, and non-linear paths.
Say your primary revenue driver is doing great online. You rarely have to convert customers through manual means, like phone and email. However, you also want to boost sales for your second-highest-grossing item. Even though this item is simple to book online, customers are still calling and emailing frequently about it. You can use the Behavior Flow to see if there is an increase in looping and drops from that product page. Maybe it is not readily accessible from the homepage, or maybe the activity page needs better organization or more information to help customers decide to book.
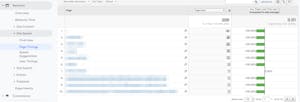
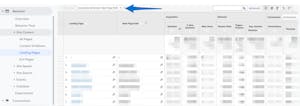
An effective way to quantify what you’re seeing on the Behavior Flow report is to use a comparison table. Go to Behavior > Site Content > Landing Pages. Here, you can add a secondary dimension on the table to see the second page where customers are landing. We use this report frequently to make sure that we are setting up clear paths for our customers, making their decisions easy to increase conversions.
For example, maybe you offer tours in different locations, and this is the primary consideration for customers. They should be met with this information immediately in the Discovery phase, and you should create a clear decision tree for them. Their first interaction should clearly lead them to their preferred location (the second page). They would then start moving into the Qualification phase in their chosen location. You could use this report to quantify which choices should carry prominence. Maybe your main revenue driver is in one location, but overall another location is more lucrative. You would be able to see this on the report and organize the UX for the customer to help make their decisions easier and increase your revenue.
The more time you spend exploring the reports on Google Analytics, the more you’ll understand how customers are encountering your business on the web and the journey they’re taking to make a booking. Reports contain information instrumental in helping you improve your online performance, whether it’s boosting your SEO or reorganizing how the information is presented on the mobile version of your website. Take some time to explore reports, and use this data to inform your website decisions. For more optimization tips, explore our website guides.