- 60 minutes
- Local Strategies
- Websites
Better Data, Better Decisions: Using Consumer Narratives with Google Analytics
Beginner,
Intermediate
Join hundreds of other operators and REGISTER NOW for Spark 2024 New Orleans October 13-15th!


There are a lot of how-to’s on navigating Google Analytics, including what each report means and how to properly set up various filters, custom segments, referral exclusions, and just about every feature that’s available on the tracking platform. The goal of this guide is to give you a framework for turning data analysis into data application. It’s important to tell a story with your data so that it connects to the user experience of your site and entire online performance.
Jump online and go through the process to book your tour or activity. Think through every single step that the user takes from the time their device lights up through to plugging in their credit card numbers. What happens from that first moment all the way through to the end of their transaction? How do they feel at each step? How do they get to the next step? How long does it take them? This process should take you a little while.
It can be tricky to think through how one of your customers works through the process versus how YOU work through it. Let’s face it – you are one of the least representative subjects to evaluate your own online user experience. You are the expert in your business. You know the ins and outs and all of those little details that aren’t intuitive to someone who isn’t familiar with your offering. This is why, at FareHarbor, we stress analyzing data and your online experience using a Discovery, Qualification, Conversion (DQC) framework.
This framework is meant to frame your analysis so that you can provide an effective insight into how users perform on your site. The DQC framework represents the consumer funnel and helps you to focus your analysis on which part of the funnel might be the issue.
This is the very beginning of your consumer journey. Customers need to know what you do, why you are valuable, why that is important to them, and why they should buy in. Discovery is your acquisition pool, the widest net you can cast. There should be a clear purpose for your SEO strategy, content, and branding.
Qualification applies to the mid-funnel interactions on your site. These are the hooks that keep the customer invested in your brand and on your site. You need logical paths that create sales. Go ahead and assume likely decisions and make it easy for people to get there. Provide key information the customer needs: tour offering, cost, party accommodations, schedule, and emotional buy-in.
 At this point in the funnel, your customers have a binary decision: yes or no. Do not make your customers work — help them make the final decision effortlessly. Be consistent in your voice, brand, and the information presented. You need to establish trust so they feel comfortable booking with you.
You may be familiar with Google’s ABC funnel, which stands for Audience/Acquisition, Behavior, and Conversion. These are the buckets that Google uses to format its analytics platform. The DQC framework represents the consumer journey, while the ABC funnel relates to the analysis of data.
In terms of how they relate, there is a one-to-one comparison that can be made. Generally speaking, Discovery = Audience/Acquisition, Qualification = Behavior, and (you guessed it) Conversion = Conversion. There will be some overlap, and you should review every report and dimension on whether it relates to a Discovery, Qualification, or Conversions issue.
An effective way to use data, especially that of Google Analytics, is to identify strengths and weaknesses so that you can pinpoint traits unique to each and compare accordingly. This helps you uncover real action rather than just points of data. Take what works well and apply that to what works poorly.
Google Analytics’ ABC funnel is how the reports are formatted on the platform for you to work through them. In order to structure your analysis to narrow down a consumer narrative, we recommend turning the funnel slightly on its head. Instead of ABC, think of a CAB funnel. We start with Conversions to gauge the overall health of the site, followed by Audience/Acquisition, and finally, we look at Behavior. This order of analysis allows you to create a narrative of user segments that perform well and those that perform poorly.
When you begin your analysis, you want to take an immediate snapshot of where you stand. Looking at the Conversions reports helps you understand your current performance and also how to project changes moving forward. Following Conversions, you’ll review Audience and Acquisition reports. Identify the origin and makeup of your users and give your audience a persona. Here, you’ll be able to see which customer identities bring you the most value, which bring you the least, and which ones would benefit from immediate attention. Finish your analysis funnel with Behavior reports. Look at your users’ habits on your site — once you understand the different personas using your site, you can determine how to adjust their behavior for better performance.
At each step, narrow your focus into one narrative. Ask yourself: Are the primary issues related to Discovery, Qualification, or Conversion? The answer will help you determine where you should be spending time and money.
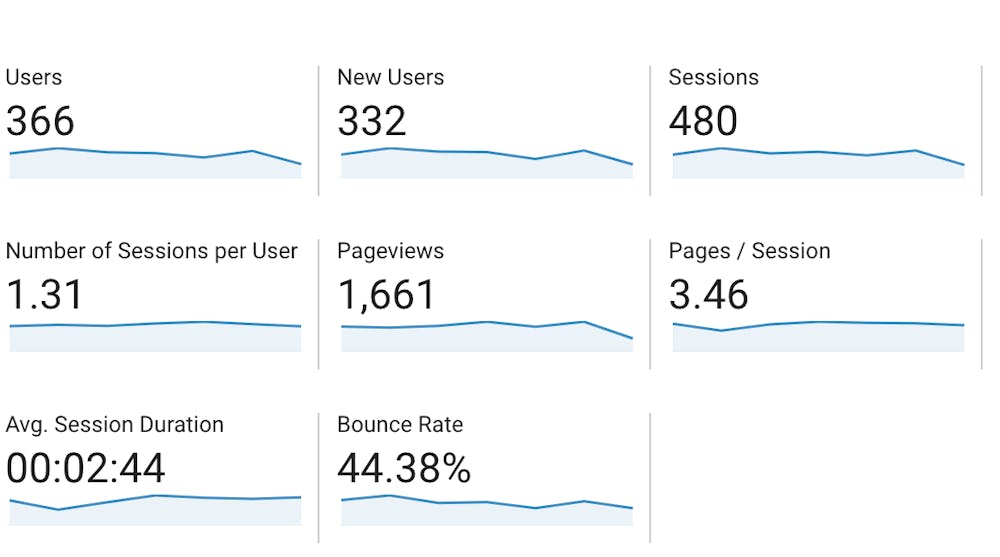 You need to examine the traffic to your site. Is the traffic low? Is another channel larger than Organic? Examine the users, sessions, and clicks within the context of a story. If there are traffic issues, customers can’t find you or are unqualified. You need to devote your efforts to search engine optimization. Issues with early funnel site behavior can also relate to customers getting to your site due to faulty keywords. They might not know who you are when they land on the site. Customers may not trust the security of your site and thus, your brand. These issues are reflected in Bounce Rates, Average Session Duration, and Average Pages/Session. All of these metrics need to be reviewed in the context of your offering, region, and customer narrative. Ask yourself: What makes sense for my site?
Dig into your on-site behavior. If there are loops and drops in the Behavior Flow report, customers are having a difficult time navigating your site to an end goal. This confusion is devastating to your online success. You want to see customers moving from their landing page to an offering page and ending on the /embed page, which is the FareHarbor book form. If there is a low Ecommerce Conversion Rate, customers may have an issue with pricing, trip details, or other content being too thin before they go to book. Customers can’t find the information they need if there are incredibly long or short Average Session Durations (compared to a strong cohort). In the end, you need to ask yourself: Do users get everything they need to know about your offering quickly and effectively?
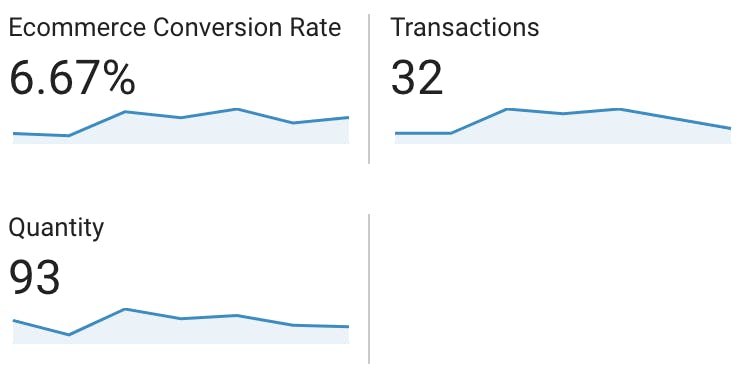 If you’ve determined that there’s a Conversion issue, you need to check the end of your consumer journey. A low Ecommerce Conversion Rate can be indicative of a checkout issue. Does your book form have an intuitive flow, relevant and compelling information, or any potential confusion? Low revenue or transaction values compared to other products/cohorts could indicate a lack of clear calls to action. If there’s a high exit percentage for /embed pages, you need to evaluate whether or not you’ve introduced any contradictory information at the end of the funnel.
In the end, it’s all about moving from data analysis to data application. Go back to your strongest consumer narratives and compare them to the ones that you want to investigate. You need to ask yourself: What are the controllable differences? Put yourself in the customers’ shoes. Play out the scenarios from the narratives you’ve constructed. For a customer who doesn’t know what they’re looking for just yet, do you create enough incentive to lead them to a product? For a customer who wants something specific, are you guiding them to their conclusion? When you alter the necessary variables, make sure to use annotations to build your case study.
When you’re building your case study, feel free to use a Word doc, Google Data Studio, or even pen and paper. The key is to use whatever works for you to refer back to. Once you’ve made your changes and recorded everything, it’s imperative to keep reviewing and collecting data. You need to be able to determine if your changes had an effect. You may need to pivot if things have taken a downturn. That’s okay. Go back and review your analysis and application to pivot to what might work.
In the end, this is an iterative process that’s never truly “done.” The landscape is constantly changing, as are your customers’ needs. You need to continually go back and go through the entire process at regular intervals. Build your narratives again with a fresh perspective and make changes.
The digital space of the tours and activities industry is still very much in its infancy. There is so much still left on the table for you to succeed. The key to your success will be to truly understand your consumers and make data-backed decisions to drive your strategy.