- 12 minute read
- SEO
- Websites
All Skill Levels
Join hundreds of other operators and REGISTER NOW for Spark 2024 New Orleans October 13-15th!


We’ve all visited a site that takes too long to load and when that happens we navigate away to another site in the SERP. That is a bad experience for the user, and is detrimental to the overall success of the website. Not only is site speed important for the overall user experience, it has also quickly become a significant SEO ranking factor – something most SEOs have long assumed and has now been confirmed by Google.
When a page takes too long to load, it results in a higher bounce rate and lower time on page, which directly affects conversion rates. A Think with Google study found that
A 1-second delay in site speed can lead up to a 20% decrease in conversions.
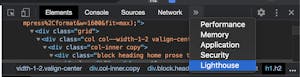
While many website owners understand the importance of site speed, not everyone knows the steps to take to assess and improve your load time. One of the handiest tools available is Google Lighthouse. This tool was once used exclusively by developers, but Google has made it more accessible for the average user, making it easier than ever for the average user to identify, evaluate, and fix site speed issues.
This guide covers how to run a Google Lighthouse audit and how to use those insights to improve your site speed. Let’s get started!

 Pro tip: Keep in mind that the report generated will be only for the page you’re on. Some pages on your website, like your homepage, are more robust than others because there are more elements to load. We recommend testing a few different pages — like your homepage, an activity page, and a blog post — to get a full idea of how your website is performing overall.
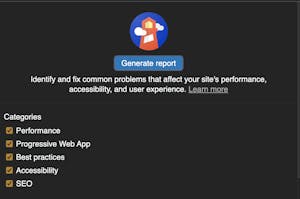
Your Lighthouse report provides scores from a range of 0-100 (100 being the best score) in four different categories:
The report then breaks down each category into various metrics to help you understand which elements are affecting the score and how you can improve them. The elements that affect page speed are listed in the Performance category.
Analyzing your scores in the above metrics will help you determine what steps you need to take to improve your site speed. Here are some of the main ways you can do this based on your Lighthouse report.
 Optimize Images
Every website needs high-quality images, especially in the tours and activities industry. However, they can take a long time to load. Optimize your images by converting them to a format like JPEG 2000, JPEG XR, or WebP. This compresses the images so they’ll load more quickly without losing quality. Another way to cut down on image load time is to use responsive images, creating different image sizes for desktop and mobile and serving the right image depending on the device.
Eliminate Render-BlockingWhen users visit your page, their browser needs to request, download, and process any external CSS and JavaScript elements, a process known as render-blocking. Of course, this takes time, slowing down the load time of the page. In order to cut down on render-blocking, consider including any vital pieces of JavaScript or CSS inline in the HTML. For less critical elements, you can use “async” or “defer” attributes to delay their loading, allowing the most important elements of the page to load first.
Deliver Smaller PayloadsOne way to cut down on load time is to reduce the file size of your script (HTML, CSS, or JavaScript) through minification or compression so it will load faster. Minification reduces the number of characters by removing comments, unnecessary white spaces, and other non-critical elements that would otherwise have to be explicitly ignored. You can also use a compression tool to fit the script into a smaller file size, much like you would use a zip folder.
Extend Browser CachingBrowsers can temporarily store a file (like the images or CSS from a webpage) in the cache and access the local copy every time the visitor returns to that page. The cached files load more quickly, which comes in handy for repeat visitors to your site. Typically, browsers will only cache files for a few minutes. If you have files on your website that don’t change often, such as the images, you can extend the length of the cache time. If someone is visiting your site multiple times during their travel research, this quick load time can lead to better conversions!
Google has made it easier to understand your website’s performance and identify areas for improvement with Lighthouse audits. However, some of these more technical elements are best left to your website developer. Start by running an audit to gain insight into your page speed. If you find any elements that are slowing down your page speed significantly, work with your developer to create a plan to remove or improve them.
For more tips on how to optimize your website, read our guide on the top website mistakes and how to fix them.