- Content Marketing
- SEO
- Websites
All Skill Levels
Join hundreds of other operators and REGISTER NOW for Spark 2024 New Orleans October 13-15th!


You’re probably already familiar with Google Analytics, but as a business owner, it’s equally important to use Google Search Console, a free tool that allows you to analyze your site’s performance in the search engines and troubleshoot any issues. Google Search Console (previously known as Google Webmaster Tools) shows you how Google views your website, which is crucial to understanding how to improve your technical SEO elements.
GSC is also what you use to submit a sitemap, view mobile usability, submit fixes to any crawling or indexing issues, and more. While Google Analytics gives you data on your site’s visitors and how they behave, GSC provides insight into how search engines see and index your site and identifies any issues that could be costing you valuable traffic.
This guide will provide an overview of how to use GSC, some of the major reports and what they mean, and the sitemap tools you need to be familiar with. We will cover how to use and understand GSC, but if you need to set it up first, head to this useful guide from Moz. If you’re on a FareHarbor Site, then you already have GSC set up under your Google Analytics profile!
If you’re logging into GSC for the first time, it can feel a little overwhelming, but this tool offers valuable reports and data that will help you understand and improve your site’s performance and discoverability in search engines. There are a variety of reports you can explore on GSC, and new ones are often added, but this guide covers the basics you need to know to make the most of GSC: Performance, Coverage, and Sitemaps. You’ll be navigating GSC like a pro in no time!
The first tab to navigate to as you start digging into your site data is the Performance tab on the left-hand menu. This section allows you to:
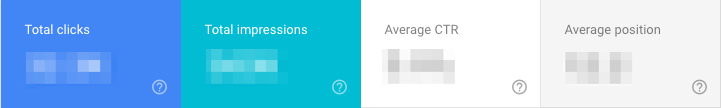
Clicks refer to the number of times searchers have clicked on your site from the SERP.
Impressions refer to the number of times your site has appeared in a SERP.
 Pro tip: To see how many impressions you’re receiving for a specific query, add a new filter by clicking +NEW > Query, and enter the keyword you want to filter for.

Average CTR refers to the percentage of people who saw your site in the SERP and clicked on it.
Average position refers to the average ranking of a page in the selected time period. If you’re filtering for a specific query, then you’ll see the average position for that specific keyword. When viewing your average position, remember that positions change, so what was true during the time frame you’re viewing might not be true today.
Analyzing this data gives you a clear idea of how you’re performing in search engine results and how to improve. For example, if your click-through rate is low, it could be time to update your meta descriptions and title tags to make them more accurate and enticing, driving more searchers to click.
You can adjust the time frame to explore how this data changes over time, allowing you to see whether your SEO efforts are improving your traffic. You can also filter by search type (Web, Image, or Video) and compare them to better understand what is driving searchers to your site.
Under Performance, you can also see which search queries are driving traffic to your site, showing you how your keyword optimizations are working for you, which pages are getting the most clicks and impressions, which countries and types of devices you’re getting traffic from, and more.
Under the Index section on the left-hand menu, you can find the Coverage tab, which shows you how your website’s pages are indexed in Google and display any indexing errors that need your attention. When you submit a sitemap, it’s crucial to check this tab to ensure that your site was crawled and indexed properly. After that, you can check this tab once a month or so to check up on any new issues, and you can also opt-in to receive email notifications when a new error pops up.

As you click through the various elements on this page, you can see which pages have errors, which have been indexed but have potential issues, which are indexed with no issues, and which are not indexed. Let’s go over what each of these means:
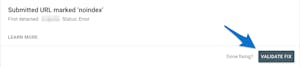
Error: If you have any pages listed here, it means that Google’s crawler encountered an issue when trying to crawl and understand this page. A page with an error is ultimately ignored by Google and not ranked. Any pages with errors should be addressed immediately. To address an error, click on the page in the Details section, fix the issue, then click on Validate Fix, which tells Google to crawl that page again.
To understand what each error means and how to fix it, explore this resource from Pepperland Marketing.
Valid with warnings: This shows you any pages that have been indexed but have some issues that might require your attention. For example, there might be a page that is being blocked by robots.txt, even though you actually want that page to be found by searchers. Keep an eye on this tab to make sure your pages are crawled and indexed the way you intended.
Valid: Under Valid, you can see all the pages that have been successfully crawled and indexed. Ideally, you want all your indexed pages to appear here. You can also see the status of each page. For example, you might notice a page that was indexed but wasn’t submitted to the sitemap. It’s a good idea to check this list every now and then to make sure that it doesn’t include any pages you did not want to index.
Excluded: This shows you the pages that are not indexed, most likely because you told Google not to do so. It’s a good idea to check this list every now and then to make sure it doesn’t contain any pages you do want to index.
Just under Coverage on the left-hand menu, you’ll find the Sitemaps tab. This is where you submit your XML sitemap — the roadmap to all your site’s pages — to be crawled by Google. Submitting your sitemap makes it easier for Google to find and index your most important pages and posts, in turn making it easier for the search engine to index your pages correctly.
If you make any large structural changes to your site, like updating multiple important pages or changing how your URLs are nested, you should submit a new sitemap to GSC, telling Google to crawl and index your site again to reflect the changes you made. If you’re on a FareHarbor site, then we have already created and submitted your sitemap for you!
Google Search Console is an important tool that allows you to better understand how your site is seen by search engines and how you can improve it. It gives you additional insight that you can’t find on Google Analytics, and it allows you to take action to improve your site’s performance. Ready to dive in? Head over to your GSC account and start analyzing your data. For more on how you can improve your search engine performance, head over to our SEO guides.