- 7 minute read
- Business Management Tips
- Industry Insights
- Local Strategies
All Skill Levels
Join hundreds of other operators and REGISTER NOW for Spark 2024 New Orleans October 13-15th!


Do you have a good understanding of how far in advance your customers typically book? How about which activity start times are most popular?
Eliminate the guesswork by running three quick and easy reports right in your Dashboard.
These reports give you insights into customer behavior and booking patterns to help you test new strategies and make better business decisions in the long run.
 What you will learn: Which activity times are most booked by your customers
You might already know that Saturday mornings at 10am are your busiest time of day, but it’s really helpful to know when all of your busy windows fall so you can best prepare.
When you have this data, you can use it to make business considerations, like potentially changing your availability start times to meet demand.
These improvements ease the burden of your busy window and improve the customer experience.
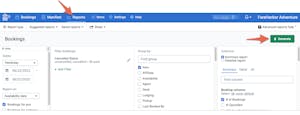
After the report generates, the data will be grouped by item and availability hour so you can determine which times are typically your busiest.
What you will learn: Which days of the week are most often booked by your customers
Similar to the booking trends by time of day report, knowing which days of the week are typically your busiest can help you implement new business strategies and improve the customer experience.
 Pro Tip: If you’re going to change your hours of operation or make other big updates, just be sure to update the information on your website, Google My Business page, and third-party sites like Tripadvisor. Make sure to claim your listings on these websites to ensure you have control over what information is being shared.
You will again see the bookings grouped by item and showing which days of the week have the most bookings. Sort by number of bookings to quickly see which days were most popular.
What you will learn: How far in advance of the activity customers complete their booking
Whether your customers typically book at the last minute or plan their activities well in advance, it’s easier to market your tours and activities when you know the booking habits of your target audience. Knowing when the average customer books is also great for planning for your busy season.
If your customers book far in advance, you can assume they are planners who likely research your business as well as potential competitors before booking. You can capture this audience by strategically planning your marketing initiatives around that early booking window.
For example, if the average booking-ahead window is 60 days, start marketing your tours and activities two months ahead of your busy season. This can also apply to holidays, school vacation periods, and big events like festivals or holiday lights shows.
Since your target audience is made up of early bookers, you’ll want to provide plentiful information on your website like content about what to do in the area, what to expect ahead of the activity, and other resources.
When it comes to website updates, new tour launches, and email or social media campaigns, plan in advance around your average booking-ahead window to capture bookings for your busy season.
This report is also great for determining how many last-minute bookers you get. These could be as last-minute as the week of the activity or even the day of depending on when your booking cutoff window is.
Since most last-minute bookers are already at your destination, you can use this information to consider how you market your business.
For example, for an audience of primarily in-destination bookers, local SEO is essential to capture people searching for things to do near them.
One of the best ways to cater to in-destination bookers is to make sure your Google My Business page is optimized and up to date with your current hours and contact information, seasonal photos, and good reviews. This improves your chances of Google displaying your business in the local map pack for “near me” searches.
You can also attract in-destination customers by partnering with local businesses, submitting your business listing to local directories, and working with destination marketing organizations.
When it comes to last-minute bookings, your website is a useful tool. Include verbiage on your site that walk-ins and same-day bookings are welcome (if that is the case).
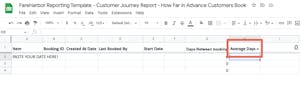
Once the data is in the spreadsheet, it will tell you the average number of days before the activity that customers book.
These reports are great for getting a pulse on your business, whether your busy season is in full swing or you’re enjoying the off season. Use the data to pivot your strategies or see where you can improve. To see a step-by-step run through of these reports, check out this webinar on the same topic.