- 5 minute read
- Digital Marketing
- Industry Insights
- Reputation Management
Customer Feedback: 2 Surveys That Will Give You Actionable Data
Beginner,
Intermediate
Spark is headed to the Big Easy! Join us in New Orleans October 13-15. Registration opens soon!


Reporting can feel like a very daunting task. Updating sheets every month and pulling out important insights takes up a lot of time. If you identify with those statements, we encourage you to start using Looker Studio reporting.
Formerly known as Google Data Studio, Looker Studio is a free data visualization and reporting tool. With just a few steps, you can create effective reports to help you make informed decisions about your business.
This guide will cover what Looker Studio is, the benefits of this tool as well as the steps to get started! Read to the end to access the FareHarbor Looker Studio GA4 template, which connects to your Google Analytics account and analyzes channel performance, engagement and revenue.
Looker Studio is a digital tool that transforms data into highly configurable charts and tables. The platform has the capability to sync all of your data sources so you can view it in one reporting experience for a more streamlined way to analyze your data.
You can view the information in a variety of charts including line, bar, and pie charts, geo maps, area and bubble graphs, paginated data tables, pivot tables, and more.
As we mentioned before, Looker Studio is free to use, and it connects to many data sources like Google Analytics, Facebook and more. Since it’s a web-based tool, there’s no need to install software on your computer, and all the work you do will be stored on the cloud.
Looker Studio is completely customizable and interactive, giving you the opportunity to mix and match the types of data you want to see on each report you run and apply different styles and color themes to match your reports to your business and branding.
When you’re ready to share a report, simply download it, save as a PDF, and send.
Now for the fun part. Learning how to use Looker Studio!
Simply go to the Looker Studio web page to get started. (Note: You will need to have a Google account for access, which is also free. We recommend using the same one you use to log in to Google Analytics.)
Google has several template options to choose from depending on what data you want to portray. For example, there are templates for Google Analytics, YouTube Analytics, ecommerce revenue, and more. We recommend starting with your Google Analytics data.
Whether you’re making a copy of an existing report to edit or starting from scratch, you must connect your data sources before the real magic begins.
Once in the selected report, click the “Add data” button on your toolbar. You’ll see several different options such as Google Analytics, Google Ads, Google Sheets, and more.
As a beginner, start by connecting to just one data source. Simply click on your data source choice, then “Authorize” and finally click “Add”.
Once you’ve connected data sources, you may want to customize the template further. For instance, you can select the data source for each chart within the template.
The ability to choose the look and feel of a report is great for your branding and consistency. You can change the background color, font, comparison metric colors, and more.
You also have the option to create a chart from scratch, giving you full control of your data visualization.
Which chart you pick depends on the type of data you’re displaying. For instance, a line chart could show revenue made over time or a geo map could show where your customers typically live.
It’s important to choose metrics that matter rather than attempting to display everything at once. Remember, you can add multiple pages to templates in order to expand the data.
To choose your chart type, simply click “Add a chart” in the toolbar.
The last step is learning how to share your report. You can download it as a PDF by clicking “File” > “Download as” > “PDF”. Then, you can share your reports via email, Slack, or any other means.
Or, share your reports by email by clicking “Share” on the top left corner and adding in email addresses. Looker Studio works similarly to a Google Doc in that you have to change permissions of the specific report to “Can view” or “Can edit”.
For your first Looker Studio template, start with our pre-made reports that analyze your Google Analytics data.
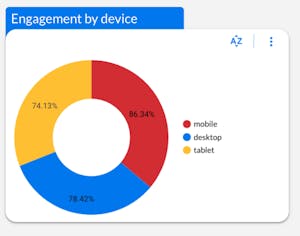
This template covers acquisition (channel performance by user), engagement by device (mobile, desktop and tablet), and e-commerce (revenue over time and product revenue). It’s a good way to easily visualize your website performance in several areas at a quick glance.
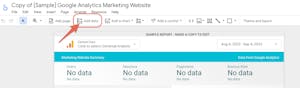
To use the FareHarbor template with your own data, you first must make a copy for your own use. Click the three dots at the top right and select “Make a copy”. An option to add a new data source will appear. At the bottom of the drop-down menu, select “Create data source” and select Google Analytics. This will prompt you to connect your GA4 account.
Click “Add to report”. Now you are able to edit! Change the name of the report to something custom to your business.
Within the report, you can add tables to analyze the specific data you are interested in. Let’s say you want to compare total users and new users.
Within the acquisition tab, click “Add a chart” in the top toolbar and select the first chart option. Drag and drop the chart into the template.
A toolbar on the right side of the screen will appear. Within the Dimension section, select the default channel group.
Scroll down to the Metric section and select which you want to analyze. For example you could choose new users, total users, and more.
You’ll see the data populate in the table you created.
Repeat these steps in the acquisition, engagement and e-commerce tabs with the relevant data you wish to view. Remember, under the Style section on the right, you can further customize the look of each chart.
Now you have the tools to start utilizing Looker Studio. Import your data, visualize the information, make intuitive decisions, and, most importantly, save yourself time!